
How well is the economy doing? And what does it mean for the bottom line for households? This is always hard to measure and even harder to agree on, particularly in the Irish economy where the activities of multinationals distort many of the key measures and where people’s experiences and circumstances have varied so much over the past decade. No point looking at a trend of GDP figures, for example, as a 26 per cent jump in 2015 does not reflect growth in any real sense.
Yet we do need to track what has happened as we have lifted out of the great economic crash. Key indicators such as employment and income levels are back at, or close to, pre-crash levels. This does not mean we are back where we were. Many parts of the economy – housing and banking, for example – have changed fundamentally. But a lot of ground has been recovered.
Circumstances vary. Some households are thriving, with new opportunities in the jobs market, salaries increasing and some easing in tax in the last couple of years. Others remain stuck – in mortgage debt due to boom-time purchases, or in jobless households. The housing crisis is affecting many, with rents soaring, house prices rising and few houses on the market. The most dire symptom is homelessness, with 1,530 families without a permanent home in November 2017, according to the latest figures.
As we emerge from the wreckage of the big recession, here are six charts which tell much of the story.
Jobs
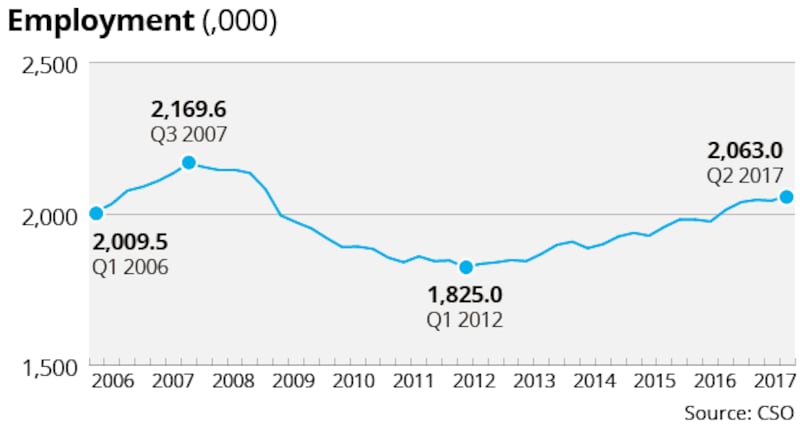
The total number of people at work is one of the best and most up-to-date measures. Huge job losses – first in construction and then across almost every sector – caused a big hit to the economy when the crisis broke. The recovery in employment in the last few years has been one of the more encouraging indicators.
We aren’t quite back to pre-crisis highs, but we are not far off. The total number of people at work reached an all-time high of just under 2.17 million in the first quarter of 2007, collapsed to 1.825 million in early 2012 and was 2.06 million in the middle of last year, according to the latest data. It will have risen a bit more since.
The bottom line: In terms of the scale of the collapse and recovery, this is probably as good an indicator as you will get. This year unemployment could fall to 5 per cent and job shortages are emerging in some areas. Many, though not all, are getting wage increases.
Income
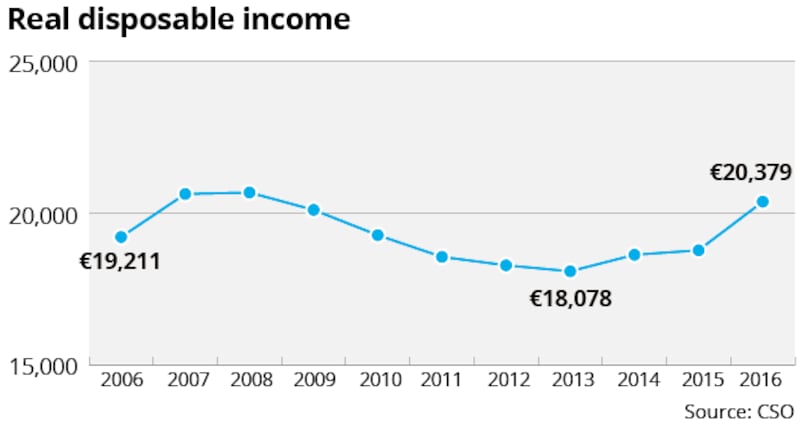
So what does it all mean in euro and cent in people’s pockets? Again this is tricky enough to measure. The best series is probably the CSO’s income and living conditions, which shows average real disposable income in 2016 back near pre-crisis peaks, either measured at an individual or household level. When you make a reasonable assumption for 2017, it is clear that disposable incomes are now back at pre-crash peaks.
This data takes into account tax changes and is also adjusted for inflation – though at a general level there hasn’t been much of that in the last few years. However, clearly family circumstances differ. For example high mortgage debt continues to hold back some households, while others have suffered from rent increases which have left costs in many areas well above pre-crisis levels. Others will have prospered more than the average due to strong wage rises in areas like technology.
The bottom line: The fall in income and the subsequent bounceback shows the real impact of the recession and recovery. The rise in incomes is now fuelling higher consumer spending, a key factor in the wider recovery.
Mortgage debt

There are a few different ways to look at how rising debts have hit households in Ireland, but perhaps the clearest is mortgage arrears. After the housing market crashed, these peaked at 143,000 cases in mid 2013, 18.5 per cent – or not far off one in five – of all mortgages. This total has since fallen to just under 72,500 in September 2016, around 9.9 per cent of the total. This is still a high figure. Overall household debt data tells a similar story –Irish household debt is falling, but remains fourth among 16 European countries, according to recent Central Bank figures. Meanwhile, the share of mortgages in negative equity has fallen from over one third in 2011 to around 10 per cent.
The bottom line: Overall the position is healthy enough – most households have seen some improvements over the past few years and few are getting worse. But for a significant minority the costs of the collapse live on through high mortgage debt levels.
Property prices

Nothing is more dramatic than the swings in house prices over the past decade. The CSO data takes 2005 as its base and shows the peak, the subsequent collapse and the rapid recovery in prices. A couple of things are worth noting. The first is that one any assessment, house prices at the peak – in 2006/7 – were out of line with what economic fundamentals justified. They then fell by more than 50 per cent – probably more than was justified – before recovering sharply.
On average, prices still remain well below peak levels, though an analysis by ESRI researchers has said they could rise by 20 per cent over the next three years. Also, work by property website Daft suggests that in some areas of Dublin prices are now less than 10 per cent below peak levels, while in a number of urban areas in Dublin, Limerick and Cork the gap has closed to around 20 per cent.
The bottom line: The key question is whether house price growth can gradually ease off, or whether we are heading for another boom and bust cycle. Much will depend on the wider economy and whether it is hit by shocks.
Bank lending
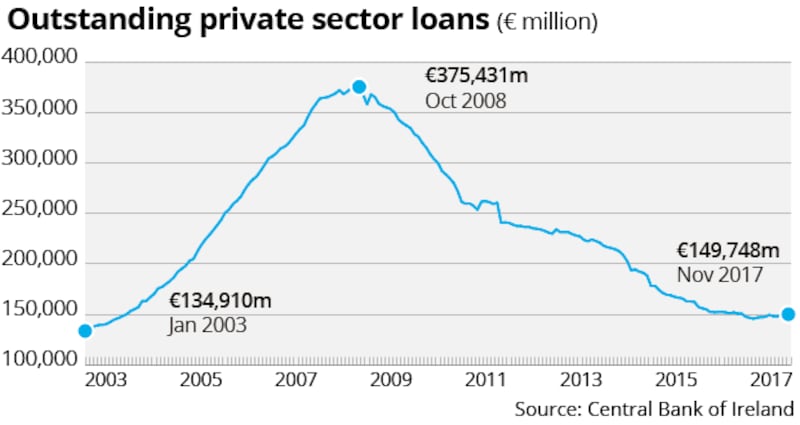
The banking sector was decimated by the collapse, mainly due to its exposure to commercial property but also to residential property and the wider economy. We are all familiar with the costs of the bail-out, but it is also worth remembering that the banks were obliged to slash the size of their loan books, while foreign lenders withdrew from the market completely.
This “Honey, I shrunk the banks” trend led to a massive collapse in total lending across the economy. The data in the graph tracks total lending – new lending minus repayments and it shows the total only now starting to level out.
In terms of new lending, there has been a significant pick up, but only in the last couple of years and from a low base. The banks are back in business, but in terms of mortgages they are tied by Central bank rules. The cost of credit also remains high compared with other countries.
The bottom line: The banking sector is only now returning to some kind of normality, but competition is lacking and credit, while available, is costly compared with elsewhere.
National debt
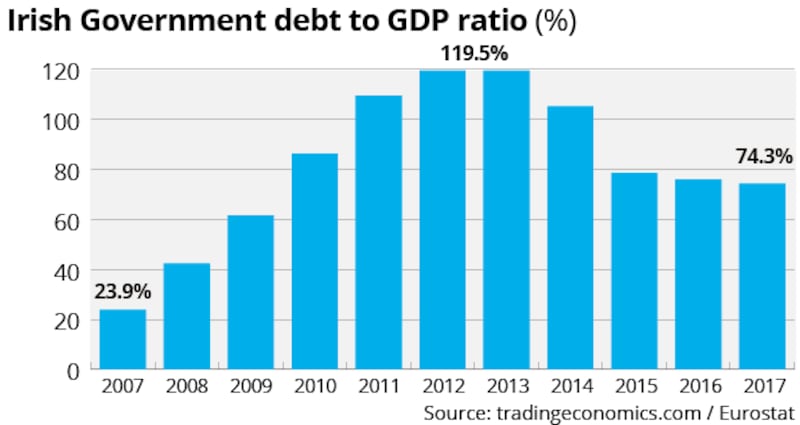
One of the reasons why we managed to escape from the bailout and the great recession was that going into the collapse, our national debt level was very low, at less then 25 per cent of GDP. It peaked at around 120 per cent of GDP, which is way, way into danger territory.
Since then the fall in the amount we borrow each year to run the country and the sharp rise in GDP has reduced the ratio to below 75 per cent.
However, here we do run into the problem of the 2105 distortion to the national account figures due to multinational activity. Netting this out suggests that the real debt-to-GDP figure is still not far off 100 per cent, meaning we need to keep reducing it to lower our economic risk.
Annual borrowing – the gap between what we spend and what we take in through revenues – shot up to a peak of more than 11 per cent of GDP in 2009 (excluding the money put into the banks).
Some €30 billion of higher taxes and lower spending followed to try to get things back in order. Combined with growth in recent years – bringing total taxes over €50 billion for the first time last year – this has brought the books back almost into balance, with forecasts that borrowing was just 0.3 per cent of GDP last year.
The bottom line: Our annual national finances are back in order, but we still have a high debt hangover which will cost us to service for many years to come.


