
Driving along the motorway on a busy day, you see brake lights ahead and slow down until the flow grinds to a halt. The traffic stutters forward for five minutes or so until, mysteriously, the way ahead is clear again. But, before long, you arrive at the back of another stagnant queue. Hold-ups like this, with no apparent cause, are known as phantom traffic jams and you may experience several such delays on a journey of a few hours.
Road operators manage motorway traffic by continuously counting cars and measuring speeds at a series of checkpoints. Traffic congestion often begins with a hold-up at a busy junction where traffic comes to a halt. Stretching back from this, there may be a series of bands of disrupted flow which propagate against the traffic like shockwaves.
Thus, when you encounter a delay, you cannot see the cause, which may have been some time ago, and well ahead of you, with its effect travelling back along the motorway in the direction opposite to the flow. Such shockwaves typically move at about 20km/h. They may travel up to 50km or more and last for several hours after the original cause of the congestion is long gone.
Modelling flow
Traffic flow can be compared to the flow of gas along a pipe, where each car is analogous to a molecule of gas. We represent both systems as continuums, ignoring the details of individual components and focusing on bulk quantities such as density, speed and flow rate. For traffic, the density is the number of cars per length of road. From the density and mean speed we can deduce the flow rate, which corresponds to the number of cars you would count in, say, one minute if you stood by the roadside.
The average speed tends to go down as the density goes up. This is mainly because drivers become more cautious when the vehicle in front gets too close. At low density, the speed is close to the maximum permitted value, say 120km/h. The speed decreases roughly linearly with density until, at the jam density of perhaps 100 cars per kilometre, the flow approaches gridlock. The flow rate varies quadratically, with a maximum value of about 3,000 cars per hour when the density is about half the critical value (see figure).
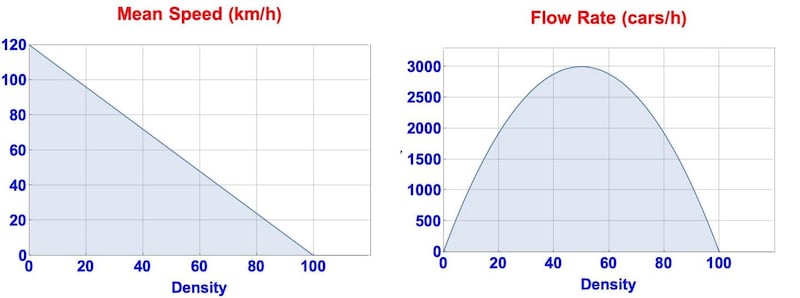
Using diagrams like that in the figure, we can show why phantom traffic jams move backwards, and we can estimate their speed of propagation. We can also explain how decreasing the average speed can actually increase the flow volume; this is a surprising and counterintuitive result.
Of course, traffic flow is much more complicated than these simple models suggest. To guarantee more accurate predictions, we require more sophisticated models with finer details of individual driver behaviour. As in many other areas of life, foolish behaviour by one person can cause major inconvenience or worse for others. A reckless lane-change can cause other drivers to react suddenly, producing a shockwave that amplifies to produce a phantom traffic jam.
Numerous other factors, such as roadworks, accidents, vehicle failure, road rage and weather conditions, are important, and traffic simulation systems continue to improve as more of these factors are included in models that combine mathematical theory and empirical techniques.


